

Metro Atlanta Home Values: What Changed in the Last 10 Years?
Metro Atlanta Home Values: What Changed in the Last 10 Years?
A Look at Home Appreciation Across the 18 Counties We Serve
If you purchased your home ten years ago, you might be surprised by how much the housing market has changed.
Metro Atlanta experienced significant home price appreciation over the past decade. Some of the largest increases occurred during 2021 and 2022, when buyer demand and limited housing inventory contributed to unusually competitive conditions.
But the market has changed since then.
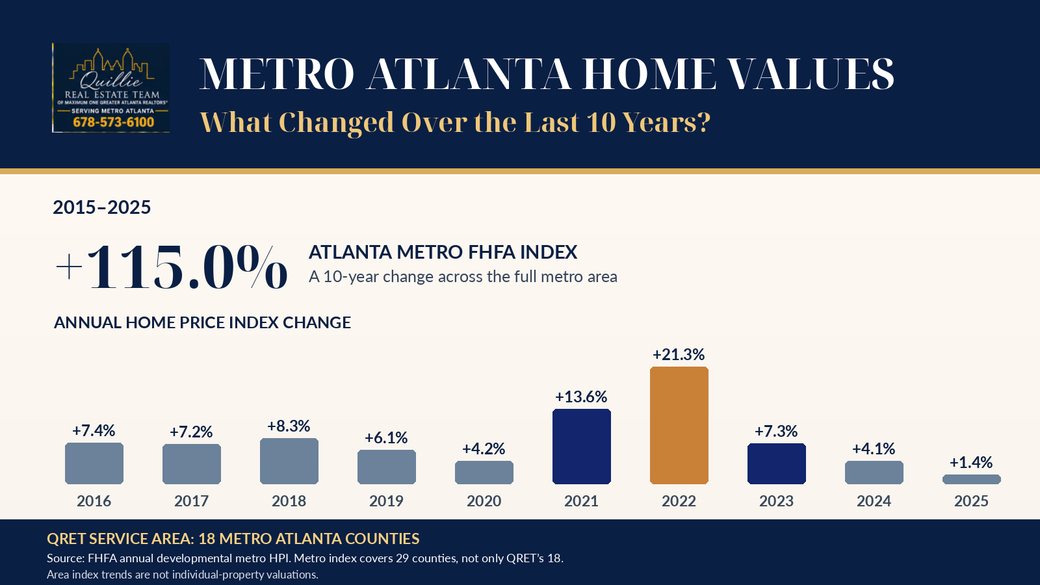
According to the Federal Housing Finance Agency, the Atlanta metropolitan area's annual House Price Index increased approximately 115.0% between 2015 and 2025.
That represents a substantial increase in the region's housing price index.
However, it does not mean every home in Metro Atlanta appreciated by the same percentage.
Let's examine what happened over those ten years and why understanding historical appreciation matters for homeowners today.
1. Ten Years of Metro Atlanta Home Appreciation
The following figures represent annual percentage changes in the Federal Housing Finance Agency House Price Index for the Atlanta metropolitan area.
These numbers describe changes in the regional housing market. They do not represent the appreciation of a particular home.
| Year | Annual Appreciation |
|---|---|
| 2016 | +7.4% |
| 2017 | +7.2% |
| 2018 | +8.3% |
| 2019 | +6.1% |
| 2020 | +4.2% |
| 2021 | +13.6% |
| 2022 | +21.3% |
| 2023 | +7.3% |
| 2024 | +4.1% |
| 2025 | +1.4% |
Source: Federal Housing Finance Agency, annual all-transactions developmental House Price Index for the Atlanta-Sandy Springs-Roswell metropolitan area. Figures rounded to one decimal place. The metropolitan index covers 29 counties, which is broader than the 18 counties served by the Quillie Real Estate TEAM.
What Stands Out?
During 2021 and 2022, home price appreciation accelerated significantly.
The metropolitan index increased approximately 13.6% in 2021 and another 21.3% in 2022.
By 2023, the pace of appreciation began to moderate.
In 2025, the metropolitan index increased approximately 1.4%, considerably below the growth experienced during the pandemic-era housing surge.
The important lesson is that housing markets do not move at the same pace every year.
2. How Did Our 18 Metro Atlanta Counties Compare?
One of the most interesting aspects of real estate is how differently nearby communities can perform.
The Quillie Real Estate TEAM serves 18 counties throughout Metro Atlanta.
The following comparison shows how the FHFA House Price Index changed in each county between 2015 and 2025.
| County | 10-Year Appreciation |
|---|---|
| Barrow | +148.5% |
| Bartow | +133.6% |
| Cherokee | +137.7% |
| Clayton | +175.9% |
| Cobb | +126.9% |
| Coweta | +114.2% |
| DeKalb | +88.8% |
| Douglas | +136.4% |
| Fayette | +101.0% |
| Forsyth | +121.2% |
| Fulton | +97.9% |
| Gwinnett | +137.4% |
| Henry | +116.9% |
| Newton | +130.5% |
| Paulding | +133.3% |
| Rockdale | +135.2% |
| Spalding | +131.5% |
| Walton | +136.6% |
Source: FHFA county-level annual all-transactions developmental House Price Index, 2015–2025. Percentage change calculated by dividing the 2025 index by the 2015 index, subtracting one, and multiplying by 100. Figures are rounded and subject to revision.
What Do These County Differences Tell Us?
Clayton County recorded one of the strongest increases among our 18 counties, with its index rising approximately 175.9%.
Barrow County also experienced substantial growth at approximately 148.5%.
Other counties, including Cherokee, Douglas, Gwinnett, and Walton, recorded significant appreciation over the decade.
DeKalb and Fulton experienced comparatively smaller percentage increases.
However, these differences do not necessarily mean that one county offers better homes or better investment opportunities than another.
A county's historical appreciation rate does not establish the current market value of any individual property.
3. What Happened During 2021 and 2022?
For many Metro Atlanta homeowners, those two years represented an extraordinary period in the housing market.
Low mortgage rates earlier in the pandemic, changing housing preferences, and limited available inventory contributed to strong buyer demand.
In some neighborhoods, buyers competed aggressively for available homes.
Multiple offers, shorter marketing periods, and rapidly increasing prices became familiar experiences.
However, the conditions that contributed to those increases were not permanent.
As mortgage rates increased and affordability became more challenging, many buyers became more selective.
The pace of appreciation moderated.
This is why homeowners should be careful about using a property's estimated value from 2022 as the basis for determining what it might sell for today.
4. Does Historical Appreciation Determine Your Home's Current Market Value?
No. And this is one of the most important points homeowners should understand.
Historical appreciation measures how home prices changed across a geographic area.
It does not necessarily describe what happened to your particular property.
Consider two homes in the same neighborhood.
One homeowner has completed major improvements, maintained the property carefully, and updated important features.
The other property may require substantial repairs.
Even if both homes are in the same ZIP code, their possible selling prices may be significantly different.
Other factors affecting market value include:
- Recent comparable home sales
- Property location and neighborhood
- Home condition and improvements
- Square footage and floor plan
- Lot size and characteristics
- Current competing listings
- New construction and builder incentives
- Current buyer demand
The market establishes the broader environment. Your property's individual characteristics help determine its potential selling price.
5. What About Homeowners Who Purchased 10 or 20 Years Ago?
If you purchased your home many years ago, you may have experienced substantial appreciation.
But appreciation and home equity are not the same thing.
Appreciation represents an increase in property value.
Equity generally represents the difference between your home's current market value and the outstanding mortgage debt or other liens secured by the property.
For homeowners who have made regular mortgage payments over many years, principal reduction may have contributed to additional equity.
Still, understanding your financial position starts with knowing what your home may realistically be worth today.
That requires more than applying a historical appreciation percentage to your original purchase price.
6. What Could Your Metro Atlanta Home Be Worth Today?
Perhaps you purchased your home in Douglasville, Marietta, Dallas, Alpharetta, Lawrenceville, or another Metro Atlanta community several years ago.
You have watched neighborhoods change, new developments appear, and property values rise and fall.
Historical market appreciation can tell you something about that journey.
But it cannot answer the question that may matter most today:
The Quillie Real Estate TEAM provides a convenient starting point.
Our Home Worth Today feature allows you to enter your property address and explore your home's current estimated market value and available selling options.
For a more personalized review, we can consider your property's condition, improvements, relevant comparable sales, and current competition.
Whether you are thinking about selling soon, considering downsizing, or simply planning for the future, understanding today's estimated value can help you make better-informed decisions.
Discover what your particular home could be worth in today's market.
Start with your property address. Explore your current estimated value and available selling options.
SEE WHAT MY HOME COULD BE WORTH TODAYNo Obligation to Sell
A Final Thought
Homeownership can be one of the most significant financial commitments a family makes.
Over time, changing market conditions may create opportunities for homeowners.
But making informed decisions requires understanding both historical trends and current property values.
The best place to begin is with accurate information about your particular home.
QUILLIE REAL ESTATE TEAM
at MAXIMUM ONE GREATER ATLANTA REALTORS®
Seller Information: 877-705-SOLD (7653)
My job is to make your job easier.
Historical appreciation figures are based on Federal Housing Finance Agency annual all-transactions developmental House Price Index data for 2015 through 2025. The indexes may be revised.
The Atlanta metropolitan index represents a 29-county region, while the county comparison focuses on the 18 counties served by the Quillie Real Estate TEAM.
Historical housing price indexes are not property-specific appraisals, estimates of home equity, or guarantees of future appreciation.
Automated home valuations are estimates and may differ from actual selling prices.
Sources: Federal Housing Finance Agency | Federal Reserve Bank of St. Louis FRED
Categories
Recent Posts









GET MORE INFORMATION